


image: thumbnail.jpg
Communicating Data Science with Shiny! 🚀 Garrick Aden-Buie #datascience #datavisualization #shiny
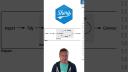
Ever seen this diagram? 📊 It's from R for Data Science, outlining the journey of tackling new data problems.
1️⃣ Start: Import and tidy your data.
2️⃣ Cycle: Transform, visualize, and model your data.
3️⃣ Communicate: Share your findings.
But communication isn't just the end—it's an ongoing process! Shiny apps are your secret weapon for this. 💡
🔄 Scenario 1: Quick Shiny app for colleague feedback ➡️ refine your work.
🌟 Scenario 2: Small app grows into a full-featured web application.
From small, quick-use apps to robust final products, Shiny evolves with your project needs. Discover why Shiny is essential for every data scientist! 🔍
Get Started: https://shiny.posit.co #positshorts
1️⃣ Start: Import and tidy your data.
2️⃣ Cycle: Transform, visualize, and model your data.
3️⃣ Communicate: Share your findings.
But communication isn't just the end—it's an ongoing process! Shiny apps are your secret weapon for this. 💡
🔄 Scenario 1: Quick Shiny app for colleague feedback ➡️ refine your work.
🌟 Scenario 2: Small app grows into a full-featured web application.
From small, quick-use apps to robust final products, Shiny evolves with your project needs. Discover why Shiny is essential for every data scientist! 🔍
Get Started: https://shiny.posit.co #positshorts
Transcript#
This transcript was generated automatically and may contain errors.
Have you ever seen this diagram? It's from the R for Data Science book, and it describes the process that you go through as a data scientist when you approach a new problem. First, you import your data, and you get it into a nice, tidy format so that the next steps are easier. Then you go through a cycle of transforming, visualizing, and modeling your data until you have results that you're ready to communicate.
We often think of this last step of communication as the final step of your project, but in reality, this step can happen many times, and Shiny is a great fit for this. Imagine that you're working on your project and you realize that you have a choice to make, so you throw together a quick Shiny app to show to your colleagues. They give you some good feedback, and you go back to the cycle of transforming, visualizing, and modeling again. You only used that Shiny app once, but it was still useful and helpful in your process.
In another scenario, you bring a small Shiny app to your colleagues, and they actually suggest some new features that you could add to the app. And pretty soon you have a full-featured web application built from Shiny. And this is why Shiny is great. It's perfect for those small apps, and it's robust enough to grow with you to be the final product that you deliver.
It's perfect for those small apps, and it's robust enough to grow with you to be the final product that you deliver.
Tags:Rstudio,Data Science,Machine Learning,Python,Stats,Tidyverse,Data Visualization,Data Viz,Ggplot,Technology,Coding,Connect,Server Pro,Shiny,RMarkdown,Package Manager,CRAN,Interoperability,Serious Data Science,Dplyr,Forcats,Ggplot2,Tibble,Readr,Stringr,Tidyr,Purrr,Github,Data Wrangling,Tidy Data,Odbc,Rayshader,Plumber,Blogdown,Gt,Lazy Evaluation,Tidymodels,Statistics,Debugging,Programming Education,Rstats,Open Source,OSS,Reticulate